Current Pediatric Research
International Journal of Pediatrics
TB screening using SVM and CBC techniques
1Assistant Professor, Department of ECE, KIT-Kalaignarkarunanidhi Institute of Technology, Coimbatore, Tamil Nadu, India
2Professor, Department of ECE, KIT-Kalaignarkarunanidhi Institute of Technology, Coimbatore, Tamil Nadu, India.
3Associate Professor, Department of ECE, PSG Institute of Technology and Applied Research, Coimbatore, Tamil Nadu, India.
- *Corresponding Author:
- Udayakumar E
Assistant Professor
KIT-Kalaignarkarunanidhi Institute of Technology
Electronics and Communication Engineering
Kannampalayam Post, Coimbatore, 641402
Tamil Nadu, India.
Tel: +917708837143
E-mail: udayakumar.sujith@gmail.com
Accepted date: April 21, 2017
Tuberculosis is one of the major lung disorders in the world. The major cause for TB is spreading through the air when people who have active TB in their lungs cough, spit, speak or sneeze. It occurs often in people with HIV/AIDS and in those who smoke. The process of diagnosing is still a great challenge, since it is based on the methods developed in the last century. If left untreated the death rate of TB patients was increase due to slow and unreliable diagnosing process. The aim of this paper is to design an automated approach for finding TB. Using binary classifier, the X-rays is categorized as normal and also classifies TB on five types in the lung region. TB Screening using CAD system is already available for field development that approaches the performance of human expert. Still diagnosing TB for HIV/AIDS Patients is a challenging task and multidrug resistant. Highly standard diagnosed is lacking in last century, so the patients are left. In order to diminish the risk of TB, a new method called “conventional poster anterior chest radiographs” for detection of TB is introduced. In this method, a region of lung is extracted using a graph cut segmentation method. In this extracted segment, a set of texture and shape features is computed. The area under an ROC curve for first time is referred by (AUC) of 87% and second set of 90%. TB is classified by the threshold values.
Keywords
Tuberculosis, Area under curve, Support vector machine.
Introduction
The second leading death causing disease is Tuberculosis (TB) from infection diseases. TB is caused by bacillus Mycobacterium, which affects lungs. It spreads through medium of air by TB cough, sneeze bacteria in immune compromised HIV/AIDS patients to other persons. To monitor progress through screening by various costless technologies was created by multi drug resistant during treatment. For TB treatment several antibiotics exists. Treatment with antibiotic greatly improves the survival chance, while the mortality rates are high. Cure rates over 90% were documented in clinical trials. Diagnosing TB is a big challenge [1-4]. The test for TB was identified by mycobacterium tuberculosis in clinical sputum, where for a gold standard. To determine whether an individual has contracted TB, several skin test base, also available with help of microscope. This system was produced but not reliable. The upcoming technology, are molecular diagnostic tests for the TB detection, that are specific and highly sensitive with accurate and fast manner [5].
The aim is to reduce the burden of the disease, by introducing method for TB detecting in chest radiographs. The lung region was extracted by using a graph cut segmentation method [5- 10]. A set of shape and texture features where normal and abnormal X-Rays are classified using a binary classifier for a lung region [2]. The classifier output is confidence is classifying the input CXR (X-Ray) using decision rules and threshold as a TB positive case [11-16].
System Design
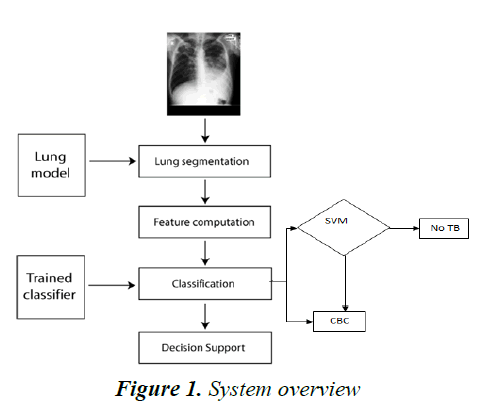
In current system, technique new bacilli, aims to a high specifying rate to reduce time period for analyzing. The Shape contour the technique is designed. The color information image segmentation is used and to categorize the simple positive or negative classification tree is used. The System Overview is shown in Figure 1.
Lung Segmentation
Using graph cut based lung segmentation method can be performed [3]. The graph cut algorithm models computer vision labeling problems such as segmentations and undirected weighted graph G=(V,E) disparity estimation as energy minimization used. The set of vertices V represents the pixels properties such as intensity and set of edges E connects these vertices. The edge weight typically represents the spatial proximity measures between vertices. The graph has two terminal FG and BG labels.
Feature Computation
For defining the segmented lungs field the normal and abnormal patterns was described. It is examined by different features set, CBIR-Based Image Features and Object Detection Inspired Features.
Classification
By using the method of Support Vector Machine (SVM) classification it is done.
SVM
SVM is used to analyze data and pattern; also it is a learning model and algorithm used for classification and analysis of regression. SVM has a one or other category of training algorithm having binary linear classifier. SVM model is representation of point in space, so the example is clear and wide as possible.
CBC
By using SVM and CBC techniques, TB detection can be done with classification as:
1. No TB Classification (Normal)
2. Class A TB with Waiver, Infectious
3. ClassB1 TB, Pulmonary
4. Class B2 TB, Latent TB Infection (LTB1) Evaluation
5. Class B3 TB, Contact Evaluation.
Results and Discussion
Showing examples of segmenting lung and the features are evaluated both in single and combined. The performance comparison of TB detection system with human expects are also compared.
Lung Segmentation using Graph Cut
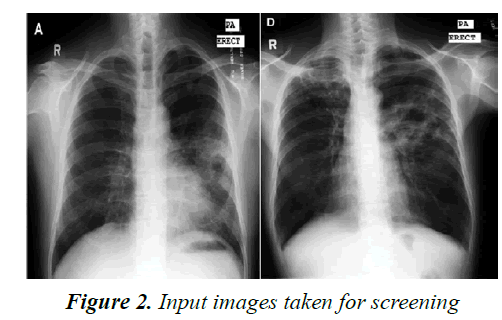
The normal lung shape was captured by the mask segmentation. In left most CXR, the infiltrates have no time paired the quality of segmentations due to the lung model use. In these images, the outline towards the tighter of diaphragm. In this segmentation algorithm and boundary lung detection algorithm are compared by the use of implementing graph cut of segmentation [13]. The true positive is referred as correctly identified lung area and false positive is referred as incorrectly identified lung area, are the used overlap measure [16]. The Input Images taken for Screening is shown in Figure 2.
Descriptor Evaluating for Feature Set A
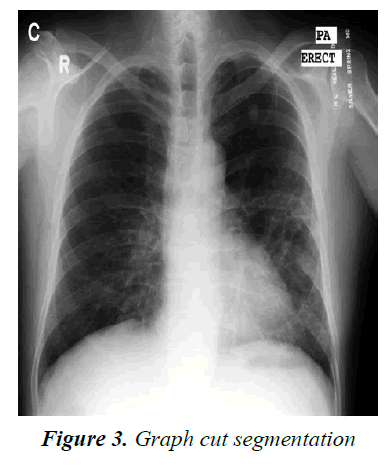
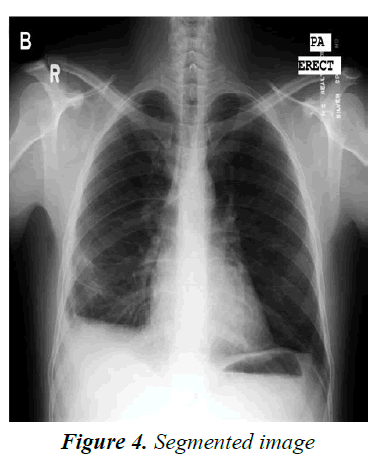
On the MC Datasheet features set A’s performance was evaluated. The descriptors in features set A is computed and concatenated them in MC Datasheet for every CXR. By applying a leave-one-out evaluation scheme by using the SVM classifier [1]. According to this scheme, the remaining feature vectors (CXR) are trained and are classified in the MC Datasheet. Evaluate for all possible descriptor subsets for the performance of leave-one-out in order to get a know the performance of every groups and descriptor, where the Graph Cut Segmentation and Segmented Image is shown in Figures 3 and 4.
In this we used natural decision boundaries for linear SVM classifier. Any pattern with positive confidence value and negative confidence value are considered to be abnormal and normal respectively. When all descriptors are added to the descriptors set achieve the accuracy of 78% and AUC value of 86.9% as highest where the accuracy is lesser than the AUC.
Machine Performance
The two dataset classification of machine from Shenzhen Hospital, china and local TB clinic of Montgomery County (MC) dataset (USA).
Montgomery County
When the false positive rate is slightly higher than 40% then its sensitivity will be about 95%.
Shenzhen Hospital
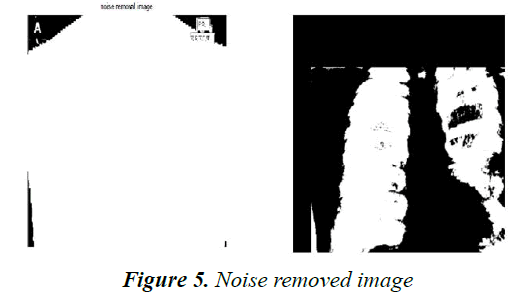
Using linear SVM, an AUC of 88.5% and accuracy of about 82% was achieved. For different datasets, a consistent performance of relevant data is provided. Where the Noise removed image is shown in Figure 5.
Comparison of Ground Truth of Montgomery CXRs with Human Consensus Performance
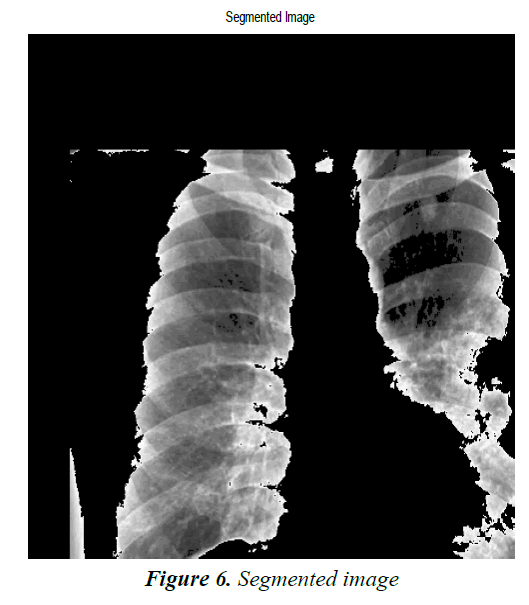
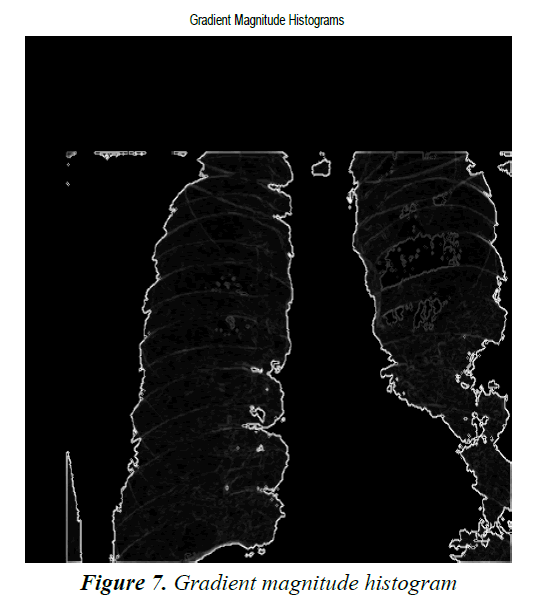
The values are obtained between (clinical officers) 70% and 72% (software) in the ROC curves area are computed. This result is compared with human performance. CXRs were divided as abnormal as TB positive and normal indicated as plus sign and negative sign respectively. Where the segmented image and gradient magnitude histogram is shown in Figures 6 and 7.
Steps that takes Place in TB Screening
Comparison with other systems in the literature: The performance numbers for full-fledged TB Screening systems is reported only for few papers in the literature. The detection problem and concentrate on sub-problem is the only part evaluated by many. The huge getal reported AUC value is also slighter than the AUC value. It uses a combination of texture and shape abnormality detectors. Each system has to evaluate on same dataset for a fair comparison of these system.
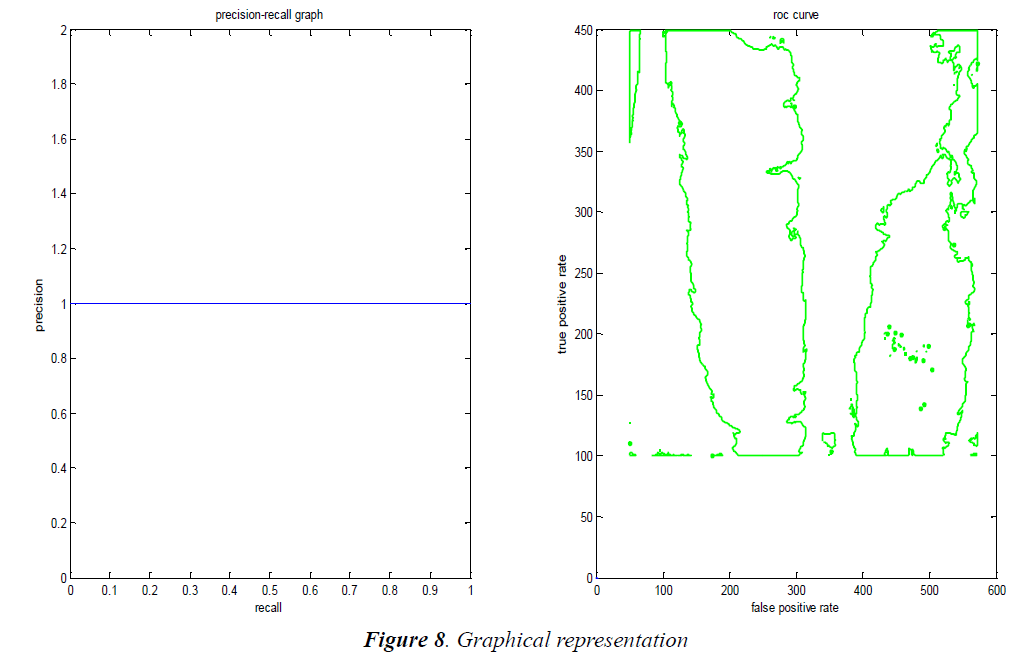
Performance comparison between machine and radiologist consensus for Montgomery CXRs: Compare machine output with the ground-truth data, using again the standard classification scheme that considers patterns classified with positive confidence as abnormal. Here, the agreement with the ground-truth data is slightly lighter than in the previous expert consensus table. The machine agrees with the groundtruth data in 78.3% of the cases (95%). Note that the false positives and the false negatives are evenly distributed, with a sensitivity of 74.1% and a specificity of 81.3%. The graphical representation is shown Figure 8. This is because it has not optimized the true positive rate for the classifier. In order for the sensitivity to be close to 100%, false positive rate would be slighter higher than 60%.
The combined human-machine performance with a significantly lighter error rate of 4.3%, compared to the machine-only error-rate of 21.7% and the human consensus error of 18.1%, suggests using the system for computeraided diagnosis and offering a verifying second opinion of radiologist readings.
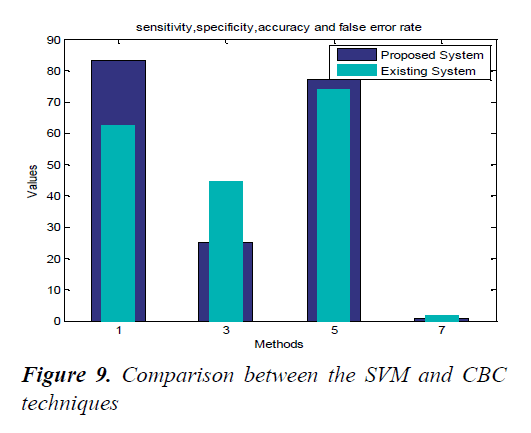
Comparison between SVM and CBC techniques: The major differences are that, CBC techniques screens along with the types of TB. But SVM techniques can find only whether the TB is present or not, (i.e.) the result is either small negative or positive as mentioned. The Comparison between the SVM and CBC techniques is shown in Figure 9.
Conclusion
In this paper, texture features, edge, a set of shape are computed as input to a binary classified, which is then classified the given input image into either abnormal or normal. It the comparison of two different established feature sets are performed where one set in image retrieval and the other used typically used for object recognition applications. Difference classifier feature and architecture sets are also experimented to provide a similar performance. To improve the performance, the lung segmentation process is improved. Finally compared to other system in the literature and achieved better performance compared to other existing method.
References
- Yogadinesh S, Manoj SO, Srihari K, et al. Certain investigation of identify the new rules and accuracy using SVM algorithm. Middle-East Journal of Scientific Research 2015; 9: 2074-2080.
- Becker H, Meyers N, Sweeney J, et al. Digital computer determination of a medical diagnostic index directly from chest X-ray images. IEEE Trans Biomed Eng 1964; 11: 67-72.
- Candemir S, Palaniappan K, Akgul Y. Multi-class regularization parameter learning for graph cut image segmentation. Proc Int Symp Biomed Image 2013: 1473-1476.
- Duncan J, Ayache N. Medical image analysis: Progress over two decades and the challenges ahead. IEEE Trans Pattern Anal Machine Intell 2000; 22: 85-106.
- Forero MG, Sroubek F, Cristobal G. Identification of tuberculosis bacteria based on shape and color. Real Time Imaging 2004; 10: 251-262.
- Ho TK. The random subspace method for constructing decision forests. IEEE Trans Pattern Anal Mach Intell 2008: 832-844.
- Jain AK, Duin RPW, Mao J. Statistical pattern recognition: A review. IEEE Trans Pattern Anal Mach Intell 2000; 22: 4-37.
- Jaeger S, Karargyris A, Antani S, et al. Detecting tuberculosis in radiographs using combined lung masks. Int Conf IEEE Eng Med Biol Soc 2012: 4978-4981.
- Li Q, Katsuragawa S, Engelmann R, et al. Development of a multiple-templates matching technique for removal of false positives in computer-aided diagnostic scheme. SPIE 2001; 4322: 1763-1770.
- Cybern M. Recognition of X-ray picture patterns. IEEE Trans Systvol SMC 1974; 4: 145-156.
- Gray MN, Huang H, Sayre J. Feature selection in the pattern classification problem of digital chest radiograph segmentation. IEEE Trans Med Imag 1995; 14: 537-547.
- Rui Y, Chen Y. Better proposal distributions: Object tracking using unscented particle filter. IEEE Conf on Computer Vision and Pattern Recognition, Kauai, Hawaii 2001; 2: 786-793.
- Seghers D, Loeckx D, Maes F, et al. Minimal shape and intensity cost path segmentation. IEEE Trans Med Imag 2007; 26: 1115-1129.
- Suzuki J, Furukawa I, Ono S, et al. Contrast mapping and evaluation for electronic X-ray images on CRT display monitor. IEEE Trans Med Imag 1997; 16: 772-784.
- Scott DW. Multivariate density estimation. Wiley 1992.
- Kailath T. The divergence and Bhattacharyya distance measures in signal selection. IEEE Trans Commun Tech 1967; 15: 52-60.
