Current Pediatric Research
International Journal of Pediatrics
A novel technique for stress recognition using ECG signal pattern
Gautam Buddha University, India
- Corresponding Author:
- Supriya Goel
Gautam Buddha University, India
Tel: +918750924100
E-mail: goel.supriya03@gmail.com
Accepted date: December 31, 2017
Motor driving under stressful conditions breaks the control over vehicle and has a major risk on the driver and also on nearby vehicles. To design a critical safe wearable driving system by continuous recognition of stress is an important research topic in present life. The present work proposes a novel technique of stress recognition by analyzing ECG signal pattern of drivers. This method also includes denoising of ECG signal for increasing accuracy of stress recognition rate by designing of an optimal filtering technique. This evaluation achieved a recognition rate of 87% when tested over a real-time database from physio net of 17 automobile drivers. It is envisioned that such a system will help to save many precious lives by providing them fast and real-time alerts.
Keywords
ECG, EEG, GSR, BP, PD, Stress recognition.
Introduction
Today, a threat or a challenge to our life is stress. Stress is a word which we generally use when we are overloaded with work or some mental pressure placed upon us. Stress is of two types: eustress and distress. Some stress is good for us which are called as eustress. Painful stress is distress. When we are in fight-or-flight response, our sympathetic system gets affected results in a stressful condition. Due to stress large quantity of chemicals cortisol, adrenaline and noradrenaline which leads to higher heart rate, sweating and alertness which help to protect in challenging or dangerous situations. In stress, digestive and immune system gets slow down and breathing, blood flow, alertness and muscle use gets faster. Nothing is more dangerous than the stress, it causes back pain, tendency to sweat, obesity, erectile dysfunction, headache, hypertension, stomach upsets and lower immunity against diseases. Stress has also a very bad effect on a person thoughts and feelings which includes anger, anxiety, burnouts, depressions, irritability, restlessness, sadness and fatigue. It also effects the behavior like eating too much or too little, sudden angry outbursts, drug or alcohol abuse, social withdrawal, frequent crying which is much dangerous than physical and mental disease. So, stress deteriorates a person physically, mentally and emotionally. Stress is much dangerous than any other problem because it has no medical treatment. To prevent from stress related problems first step is to recognize stress and then its reduction. There are many methods or symptoms of stress from which it can be recognized. Physical Symptoms like sleep disturbances, tearfulness, stomach ulcers and there are some behavioral or psychological disturbance like poor concentration, memory loss, increase in absenteeism, reduced performance, misplaced anxiety and apathy. One or more of these symptoms can be a prominent reason for a person to be in stressful state. All these symptoms are used to recognize stress and commonly known as behavioral modalities. A major drawback of using these behavioral modalities for stress recognition is uncertainty that arises in case of persons who are behaviorally suppressive or voluntarily control their emotional manifestations. For instance, although insomnia can be analyzed to determine emotions, there is no surety that an individual will express the condition, irrespective of whether they are experiencing a certain stress. This has serious implications in some applications such as surveillance [1].
An alternative instead of behavioral modalities is the physiological signals (or bio signals) which are vital signals of human body and the advantages of stress recognition by using physiological signals which are involuntary reactions of the body and very difficult to hide. Traditionally these have been used for clinical diagnosis but now these are also used for some other applications like biometric recognition, stress recognition, etc. [1-6]. This research paper considers heart as main organ of the body to detect physiological signal for stress recognition as it is affected by impact of stress.
ECG Wave
The ECG signal is an electrical illustration of the activity of the human heart. Computerized ECG analysis is commonly used as a reliable technique for the diagnosis of heart diseases. It is acquired by placing electrodes on the skin of the patient. The ECG morphology consist of P wave, Q wave, R wave, S wave, U wave, QRS complex and various other segments as shown in the Figure 1. The ‘P’ wave determines depolarization of left and right atria. As atrial muscle mass is limited, amplitude of this wave is small and its absence indicates ventricular ectopic focus. The duration of this wave is 120 ms with a positive polarity and its spectral content is 8-10 Hz, low frequencies. The depolarization of right and left ventricles corresponds to the largest wave QRS complex. The duration of this complex is 70-110 ms in a heartbeat.

Figure 1: Main components of ECG heartbeat
The T wave depicts ventricular depolarization. It has small amplitude about 300 ms after the QRS complex and its exact position depends on the heart rate.
Cardiovascular Reactivity to Stress
For psychological and physical behavior, central and peripheral nervous system of human body is responsible. CNS is the information processing unit of the body and PNS acts as communication medium between cranial activity and spinal cord. PNS system is divided into somatic and autonomic nervous system (SNS, ANS). Sympathetic and Parasympathetic system are parts of ANS system which behaves in an antagonistic manner, and they maintain balance within a body called homeostasis.
The nerve endings of ANS system play a major role in the cardiac output because the rate of blood pumps by muscles gets affected. The activated sympathetic system stimulates heart rate while parasympathetic system reduces the cardiac workload [7]. When a person is in a stressful situation, heart rate of the person gets affected and also ECG wave pattern gets affected.
The remainder of this research paper is organized as follows. Section 2 covers the background information and prior work in the area of stress recognition. Section 3 presents the experimental methods that have been designed for ECG signal processing and feature extraction method. Section 4 represents the analysis for stress recognition using ECG signal. The research paper concludes with section 5 [8-16].
Related Work
Stress is one of the major problem people are facing now a day. It is a complex mixture of psychological, mental and physical responses. People suffering from stress generally have rapid heart rate, hypertension, deflections in Galvanic Skin Response (GSR), Pupil Diameter (PD), Blood Pressure (BP). So, to recognize stress physiological measurements are important.
As compare to behavioral modalities more focus is on physiological characteristics that get affected by stress like ECG, Electroencephalogram (EEG), GSR, BP, PD. For instance Picard et al. [16] collected different physiological signals (ECG, EEG, GSR, HR) from different subjects in driving situation to measure their stress level in 2005. Apart from Picard et al. [16] developed a driving interface which is multimodal to determine various stressed states like panic, fear, boredom, frustration and fatigue using muscle activity, heart activity and finger pressure. They provided a framework for a probabilistic theoretic model that recognize stress and also optimize its feature set used in the model [8-10]. In this model, four different types of input like physiological responses, behavioral response, user performance and physical data to provide an optimal feature set to give improved stress recognition. After that Bakker et al. [1] in 2012 performed a survey by using different physiological signals to recognize stress. In 2012 researchers proposed a depth analysis of subject dependent physiological features to increase the performance of stress recognition.
All of the previous work only focusses on stress recognition using change in heart rate, blood pressure, GSR but this is not an appropriate method. So, there is a huge confusion either the person is stressed or excited because in both cases heart rate, blood pressure, GSR increases. To avoid this confusion a method is required which can recognize stress with extraction of unique features to achieve minimum confusion rate. So, in this research work ECG wave pattern is analyzed by extraction of its pattern features and isoelectric level for stress recognition. This particular type of model is a middle ground in between a specific model and generalize model.
Methodology
This research paper provides a method for stress recognition using ECG signals. In this research work, data is taken from Physio net MIT database in which 17 drivers of at least 50 min duration collected for analysis. This experiment was performed to determine stress level during real world driving situations under normal situations. ECG signals are useful metric for providing driver’s state feedback as they are collected continuously and driver performance will not have interfered. As data is taken from real time scenarios, signals get affected by different kinds of noise. So, before feature extraction first step is to denoise the signal to get accurate signal. Major artifacts present in ECG are Power Line Interference (PLI), Baseline Wander (BW), Muscle Artifacts (MA) and environmental noise [11-13]. As these noises strongly effect ST segment due to which signal quality degraded and large amplitude signals are produced in ECG which are similar to PQRST waveform, so important information gets hindered which is important for clinical diagnosis. So, it is very important to cancel ECG noise for obtaining a useful ECG signal. Main goal of ECG de-noising is to segregate pure signal elements so as to provide appropriate interpretation of ECG signal. The motive with this technique is to separate these noises from the ECG signals in order to commence a result which helps a clear and authentic analysis. Classically for smoothening, image processing and signal processing, Savitzky Golay filters were used. As by numerical analysis, SG filters derived so time domain analysis is performed. Following properties are considered:
• Polynomials Formation
• Reduction of noise
• Conserve small details
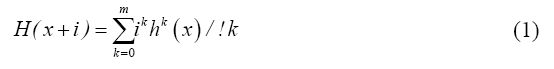
Suppose fitted the signal with polynomial, derivatives higher than m to be 0, Taylor series is given by:
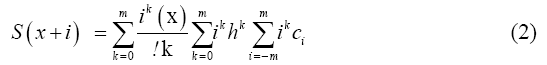
After convolution, polynomial with filter under consideration, rearranging and summation we get,
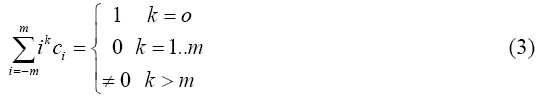
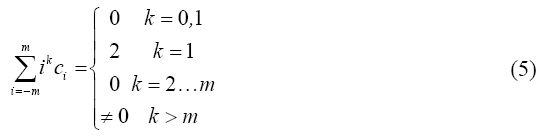
For finding the derivatives and value of de-noised polynomial of degree higher than m, satisfaction of filter coefficients is necessary with equations:
For smoothening filter:
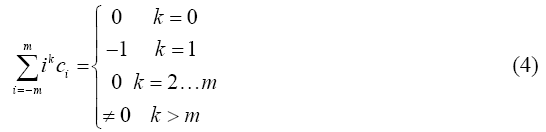
For first derivative estimation:
For second derivative estimation:
The error is constant for the first polynomial which is constantly produced. To raise the considered polynomial degree, error will be of first order and then of second order [7,8]. With proficient calculation results for filter coefficients and tests corresponded with theory. In this paper, artifacts of ECG noise get removed by using Savitzky Golay filter and modifying its characteristics, i.e., its order and side points. Performance parameters like signal to noise ratio, variance, mean, distortion are used to analyze the results (Figure 2).

Figure 2: Reproducing of output signal in accordance with increased polynomial order
To start analysis firstly theoretical analysis is performed in time and frequency analysis, and after that filter is applied to physio net ECG database. All used signals had a sampling rate of 500 Hz. The central moments have found out the values from the above equations. Output of ECG signals in increasing order of polynomial order after passing through Savitzky Golay Filter is shown in Figure 2. As we expected order of error is matched but as order increases to a high extent signal gets truncated (Figure 3).

Figure 3: Original denoised signal
By increasing polynomial order, we get following results in Table 1.
| Polynomial Order | SINAD (dB) | Duty Cycle |
|---|---|---|
| 3 | 0.4895 | 0.0288 |
| 10 | 0.4259 | 0.02941 |
| 15 | 0.4147 | 0.02788 ……………. |
| 20 | 0.7869 | 0.026411 |
| 30 | 0.95744 | 0.026411 |
Table 1: Performance parameters evaluation of output signal [Polynomial order 3, 10, 15, 20, 30]
Duty cycle of original denoised signal is 0.02511, so if we do comparison then with polynomial order and side points order 4 is most accurate as with this order SINAD is also minimum. By increasing Side points, we get the following results. Side points specifies number of data points to each side of current data points to use for the least square minimization. As side points of Savitzky Golay filter increase following results obtained. Side points specifies the number of data points to each side of current data point to use for the least square minimization (Table 2).
| Polynomial Order | SINAD (dB) | Duty Cycle |
|---|---|---|
| 6 | 0.4673 | 0.027103 |
| 8 | 0.3722 | 0.02589 |
| 12 | 0.4196 | 0.02697 |
| 15 | 0.4014 | 0.03753 |
Table 2: Performance parameters evaluation of output signal [Ploynomial 6, 8, 12, 15]
It can be concluded that increasing the order of filter polynomial and side points leads to precise preservation of minute details of QRS complex. It is also noted that use of too high order polynomials with short length leads to over fitting. If low order polynomial or very high order polynomial is used it cut down the amplitude of signal. So, there will be a balance between order of polynomial and side lobe should maintain. After denoising of ECG signal next step is feature extraction. ECG signal wave pattern is very important in stress recognition and fluctuations in normal electrical pattern shows different features to recognize stress. So, an appropriate feature extraction technique is of great need. Hence, the requirement of feature extraction is to find different factors as possible that would provide accurate recognition and efficient prognosis. In this research work important features which are used in stress recognition extracted by using lab view biomedical toolkit using dataflow modelling. After using data flow modeling, a set of eight features gets extracted. Data is converted into the ‘.edf’ format for analysis in LabVIEW (Figure 4).

Figure 4: Feature extraction of ECG
Analysis of ECG Features
The feature extraction technique is applied to the data of stressed drivers and four features i.e. isoelectric level, P wave, ST level and QRS complex gets extracted in 17 drivers. After feature extraction, all the four features get analyzed from their baseline values. Four features of ECG are mainly affected by stress are QRS wave, isoelectric level, P wave and ST wave because as stressed person’s heartbeat increases its sodium pump gets activated and isoelectric level increases. Also, due to stress action potential of body gets increases due to which QRS wave gets widened. Stress also elevates the ST wave and also P wave gets elevates because of acute transmural anterior wall ischemia as a result of this blood pressure also gets increases which causes blockage of coronary artery which is very dangerous. After optimal feature extraction next step is to find whether these features are present in our subjects and to validate the results we used statistical analysis of these features. In stressed persons, signs of acute infarction followed by T wave inversion which is known as Tako Tsubo stress cardiomyopathy is seen [14-16].
QRS widening occurs because of delay of electrical conduction system which is a major reason of cardiac arrest. From feature extraction set, four features which are affected by stress are extracted and after that mean, variance and standard deviation of those features was calculated which are represented by μ, ơ and SD. This feature used a seven-minute window of ECG signal. Following table represents the statistical analysis of features used for stress recognition. The features are evaluated accordingly and ranked individually to check the performance of the system. The mean value of all the four features gets extracted and correlated with each other. After calculating their correlation %, value of their correlated statistical features is described in Table 3. Features are tested on their ability to differentiate stress level and leave one out and test cross the validation results as shown in the Table 3.
| Feature | Mean (µ) | Variance (ơ) | Standard Deviation (SD) |
|---|---|---|---|
| Isoelectric level | 68.8% | 88% | 63.6% |
| QRS | 87.8% | 74.87% | 77.98% |
| ST | 77.9% | 89.8% | 77.77% |
| P | 82.7% | 75.87% | 87.87 |
Table 3: Correlation analysis of extracted statistical pattern features of ECG wave
The results show that recognition rate is 87%, a significant improvement over the previous results which are 82% Picard et al. [14] recognition rate.
Conclusion
Stress is much dangerous than any other disease. This research paper shows the application of ECG signal pattern analysis for stress recognition using denoising and feature extraction technique. The results show that by detecting signal pattern from combinations of features, performance of stress recognition increased significantly to 87%. This work led to improved version of complicated art of driving from ECG signal point of view and it is envisioned that such a technique can further be extended to develop psychoanalysis of driving profile and to increase road safety in future.
References
- Bakker J, Holenderski L, Kocielnik R, et al. Stress work: From measuring stress to its understanding, prediction and handling with personalized coaching. In Proceedings of the 2nd ACM SIGHIT International Health Informatics Symposium, IHI’12. ACM Press. 2012.
- Bifet A, Gavalda R. Learning from time-changing data with adaptive windowing. In Proceedings of the 7th SIAM Int. Conference on Data Mining, SDM-07. 2007.
- Boucsein W. Electrodermal activity. New York and London: Plenum Press. 1992.
- Glanz K, Schwartz M. Stress, coping and health behavior. Health Behavior and Health Education: Theory, Research and Practice 2008; 211-236.
- Hayre HS, Holland JC. Cross-correlation of voice and heart rate as stress measures. Appl Acoust 1980; 13: 57-62.
- Kifer D, Ben-David S, Gehrke J. Detecting change in data streams. In Proceedings of the International Conference on Very Large Data Bases, Toronto, Canada, 2004. Morgan Kaufmann. 180-191.
- Lang PJ, Greenwald MK, Bradley MM, et al. Hamm. Looking at pictures: Affective, facial, visceral, and behavioral reactions. Psychophysiology 1993; 30: 261-273.
- Lin J, Keogh EJ, Wei L, et al. Experiencing SAX: a novel symbolic representation of time series. Data Min Knowl Discov 2007; 15: 107-144.
- Mann HB, Whitney DR. On a test of whether one of two random variables is stochastically larger than the other. Ann Math Statistics 1947; 18: 50-60.
- Paoli P, Merllie D, Millora F. Third European survey on working conditions 2000. European Foundation for the Improvement of Living and Working Conditions. 2001.
- Pechenizkiy M, Bakker J, Zliobait E, et al. Online mass flow prediction in cfb boilers with explicit detection of sudden concept drift. SIGKDD Explor Newsl 2010; 11: 109-116.
- Ramirez-Beltran ND, Montes JA. Neural networks for online parameter change detections in time series models. Computers & Industrial Engineering, Proceeding of the 21st International Conference on Computers and Industrial Engineering 1997; 33: 337-340.
- Sanches P, Hook K, Vaara EK, et al. Mind the body! Designing a mobile stress management application encouraging personal reflection. In Conference on Designing Interactive Systems 2010; 47-56.
- Severo M, Gama J. Change detection with Kalman filter and CUSUM. In Ubiquitous Knowledge Discovery, LNCS 6202. Springer 2010; 148-162.
- Tromp E, Pechenizkiy M. Senticorr: Multilingual sentiment analysis of personal correspondence. In Proceedings of IEEE ICDM 2011 Workshops. IEEE Press, 2011.
- Picard RW, Vyzas E, Healey J, et al. Toward machine emotional Intelligence: Analysis of affective physiological state. IEEE Transactions on Pattern Analysis and Machine Intelligence 2001; 23: 1175-1191.